Saturday, 6 April 2013

Mentos and Coke: An Explosive Classroom Experiment


Fig 2: Mentos GeyserMany science experiments rely on a chemical reaction to produce the energy and gas required to create enough pressure for an explosion. These include the acid and carbonate reactions typical of simple volcano experiments and the 'elephant toothpaste' reactions where the decomposition of hydrogen peroxide into oxygen and water is catalysed. When such reaction mixtures are enclosed or confined to a restricted space, the pressure resulting from the build up of gaseous products causes an explosion.

In a chemical change, new products are formed. An example of this occurs when vinegar is added to sodium carbonate in traditional 'volcano' reactions. The new products formed in this case are carbon dioxide gas, water and sodium acetate, according to the equation below:

acetic acid (vinegar) + sodium carbonate ----> carbon dioxide + water + sodium acetate
Fig.1: Diet Coke and Mentos
When Mentos lollies are added to a carbonated drink such as Diet Coke, however, there are no new products formed. The rapid production of bubbles is instead a result of the dissolved carbon dioxide in the drink rapidly coming out of solution and forming a gas. As the gas bubbles expand, the pressure inside the bottle increases, resulting in a stream of foam shooting out through its narrow opening (see figure 1).
Why Do Mentos Lollies Cause This Explosive Reaction?
According to Steve Spangler, there are two main reasons for this rapid build up of carbon dioxide. Firstly, the gums and proteins from the Mentos coating help to break the surface tension of the water in the drink, which in turn allows the gas bubbles to escape more readily. Secondly, the many small pits on the surface of the Mentos lollies act as nucleation sites for carbon dioxide bubbles to gather in large numbers. When these two factors combine, massive amounts of foam are produced in a short space of time, creating explosive results.
Mentos and Diet Coke Experiment- Materials and Teaching Method
In this investigation students will compare the effects of plain (mint flavoured) Mentos lollies with coloured ones. The difference between these two types of lollies is their surface – the coloured ones are smooth and do not have the pitted surface typical of the plain variety. Diet Coke is usually used because it is more effective than ordinary Coke and results in a less 'sticky' clean up.
The following materials and equipment are required per group of around four students:
                2 x 1.25 litre bottles of Diet Coke
                1 packet mint Mentos
                1 packet flavoured Mentos
                2 test tubes
                2 pieces of card around 4 x 4 cm in size
                digital camera (optional)
Students should be instructed to copy down the following directions, which could be followed by a teacher-led explanation.
                Add the contents of each packet of Mentos to separate test tubes.
                Move outdoors and place the two bottles of Diet Coke next to each other on a flat surface.
                Unscrew the lids of each bottle and place the cardboard over the openings of each vessel.
                Invert the test tubes over the card. When ready, simultaneously pull the cardboard out from under each tube. Move back quickly.
                Compare the height of the fountain produced for each type of Mentos. If possible, record this with a digital camera.
The following questions could be written on the board after students write up the experiment and their observations:
1.             Which type of Mentos – plain or coloured- produced the biggest explosion?
2.             Can you suggest a reason for your observation?
3.             Explain why the experiment demonstrates a physical, rather than a chemical change.
4.             What aspects of the experiment did you control (that is, keep the same)?
Mentos and Diet Coke Experiment – Follow Up Activities
Students may wish to observe the effects of using Diet Coke compared to normal Coke or other carbonated drinks (as in figure 2). In this case, plain Mentos lollies should be used for each bottle. They could also experiment with other types of candy to find out if similar nucleation processes occur in these cases.
References
Muir, Hazel. "Science of Mentos-Diet Coke Explosions Explained." newscientist.com, 2008.
Spangler, Steve. "Mentos Diet Coke Geyser." stevespanglerscience.com, 2010.

Friday, 5 April 2013

Global Warming and Oceanic Circulation


Figure 1: 'Thermohaline Circulation'
Thermohaline Circulation - Robert Simmon, NASA

Ocean currents (collectively known as the Ocean Conveyor) driven by temperature and salinity differences move heat from Antarctic to Arctic regions via the Gulf Stream (see diagram). This is known as ‘thermohaline circulation’. 

As the heat is lost to the atmosphere in the Northern Hemisphere, the current becomes cooler and more saline (due to evaporation). As a result, it sinks and moves south. Models created by Manabe and Stouffer (1993) predicted that increasing the atmospheric CO2 concentration fourfold was enough to completely 'break down' this conveyor mechanism.
Melting of Polar Ice Caps Could Disrupt Ocean Currents

Climatologists believe that this will be caused by a large influx of fresh water, possibly from the melting of polar ice caps, which could disrupt the Gulf Stream and the North Atlantic Drift, a branch of the Gulf Stream that travels to Europe. Fresh water is less dense than salty water, and could lie on top of the warm salty water as the Ocean Conveyor moves north, preventing it from giving up its heat to the atmosphere.

The fresh water could also dilute the salty water, making it less dense and so preventing it sinking. Thus the density/salinity driving force behind the current would no longer exist. Gagosian (2003), states that the North Atlantic region has indeed been freshening dramatically in the last decade.
This slowing down or shutdown of the Ocean Conveyor could possibly result in a reduction in heat transport to Western Europe. Some climate models have predicted that Northern Hemisphere temperatures will be drastically reduced with a complete shutdown of circulation. Moreover, according to Rahmstorf (2010), the resulting climate would also be much drier.
The Ocean Conveyor was in fact disrupted during the 'Younger Dryas' era (around 12,700 years ago), causing temperature decreases of up to 5°C. In this period, severe winters lasted for years, glaciers advanced and sea ice spread, causing a large reduction in biodiversity.
Greenhouse Emissions and the Ocean Conveyor - A More Realistic Scenario
Some climatologists, however, claim that the conditions responsible for the climate disruption during this era are not comparable to those present today: during the Younger Dryas era, for instance, there was a massive influx of fresh water from the collapse of the Laurentide ice sheet rather than from polar ice melting.
Indeed, the IPCC's third Assessment Report in 2001 states that 'even in models where the thermohaline circulation (THC) weakens, there is still a warming over Europe'. Moreover, according to Rahmsdorf, a total shutdown of the THC is extremely unlikely and it is more feasible that the thermohaline circulation is merely weakened by around 20-50%.
Wood and Vellinger (2003) concur with this view, stating that the THC will ‘weaken or remain unchanged over the next century’ as a result of increased greenhouse gases and that a complete shutdown of the Ocean Conveyor would be a ‘low probability /high impact’ event.
However, even a slow disruption to the Ocean Conveyor could cause major changes in rainfall patterns in the tropics, with more extreme El Nino events, causing widespread changes in ecosystems and the expansion of deserts in some areas. Nutrient concentrations in the upper ocean may also be reduced, in turn affecting marine biodiversity and resulting in a general reduction in surface plankton. Global warming could also result in reduced overturning of the ocean around Antarctica, due to reduced sea-ice formation.
The Importance of Carbon Emission Reductions
Interestingly, Michael Schlesinger and his colleagues at the University of Illinois have used climate models to predict the percentage chances of a complete shutdown of the Ocean Conveyor with and without any global change in climate policy. They have concluded that there is a 70% chance of complete shutdown between now and 2205 in the absence of carbon taxes and a 25% chance of this occurring if these taxes are effectively implemented.
Whether these predictions are accurate or not, it is clear that additional control measures, such as carbon capture and sequestration may therefore be required to further reduce the likelihood of disruption to the thermohaline circulation.
References
Gagosian, R., 2003, ‘Abrupt climate Change: Should We Be Worried?’ Woods Hole Oceanographic Institute, whoi.edu
IPCC, 2001, IPCC Third Assessment Report, Climate Change 2001, ipcc_tar
Kloeppel, J, 2005, ‘Global Warming Could Halt Ocean Circulation, With Harmful Results’, eurekalert.com
Manabe and Stouffer, 1993, ‘Century-scale Effects of Increased Atmospheric C02 on the Ocean–atmosphere System’, Nature Publishing Group, nature.com
Rahmsdorf, S., 2010, ‘The Thermohaline Ocean Circulation – A Brief Fact Sheet’, Potsdam institute for Climate Impact Research’, pik-potsdam.de
Wood and Vellinga, 2003, ‘Global Warming and Thermohaline Circulation Stability’ Royal Society publishing.org

The Effect of Clouds on Climate Change


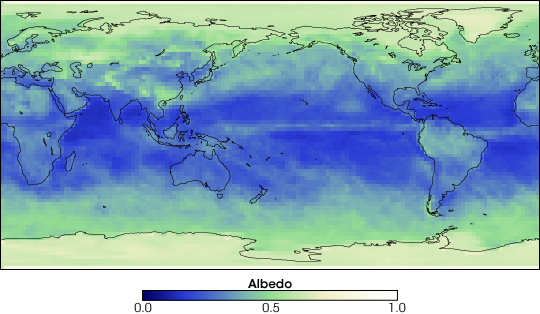
Earth's albedo in Decline - NASA
The Albedo Effect Differs According to Cloud Type

On the face of things, logic would suggest that an increase in the average atmospheric temperature will lead to greater levels of water evaporating and therefore increased cloud formation. 

This could, in turn, lead to greater reflection of solar energy from the sun (known as ‘albedo’ – see figure 1) and a reduction in global temperatures. In a way, then, amplified cloud formation could in fact negate the warming effects of increased atmospheric carbon dioxide levels, leading to an effect known as ‘negative feedback’.


Different types of clouds, however, have different effects on greenhouse warming. Lower, stratiform clouds at around 2200 m, for instance, consist of thick layers of water vapour that reflect incoming solar radiation. This helps to reduce the effect of global warming. Higher cirrus clouds (5300-14000m) that are composed mainly of ice, however, tend to trap outgoing long wave radiation while allowing solar radiation through to earth because of their low density. This subsequently results in an increase in atmospheric temperatures

The net result of these conflicting effects is around 13 watts per square metre of heat loss from the atmosphere. In other words, the negative feedback of lower to middle clouds wins out over the positive feedback produced by the higher clouds. Indeed, according to the Intergovernmental Panel on Climate Change, if all clouds were removed from the atmosphere, this cooling effect would be lost and the Earth’s climate would begin to warm up.

How Will Global Warming Affect the Behaviour of Clouds?

In the 1990s it was believed that an increase in global temperatures would simply create more of the same cloud types and therefore increase the atmosphere’s net albedo effect. Global warming would therefore be countered by greater reflection of incoming short wave radiation. Recent studies, however, have suggested that this may be too simplistic a scenario and increased atmospheric temperatures may in fact cause a reduction in the abundance of lower to middle level clouds.

According to studies carried out by Amy Clement of the University of Miami in 2009, warmer temperatures in fact resulted in decreased atmospheric circulation and reduced lower cloud formation. These studies also agreed with climate models produced at the Hadley Centre for Climate Change, and suggest that the resulting decrease in albedo will create a net warming effect on the atmosphere.
Moreover, because the atmosphere will become less stable with a rise in temperature, some scientists believe that water vapour may well be drawn up to greater altitudes, resulting in more high level clouds. As a consequence, a net warming effect (positive feedback) may result due to a reduction in albedo and an increase in the absorption of outgoing radiation by these higher, icier clouds.

What Can We Do to Reduce Global Warming?
The above study reveals that clouds are therefore not necessarily going to save us from overall global warming and may in fact act to increase its effects. With further warming it is also to be expected that polar ice, another major component of Earth’s albedo effect, will be reduced. With less short wave solar radiation being reflected back into space, a positive feedback scenario of sizeable proportions may well occur.

A general consensus among scientists and world leaders is that most global warming since the Industrial Revolution has been caused by the burning of fossil fuels and land clearing. Many countries have therefore committed to reduce their greenhouse emissions in agreements such as the Kyoto Protocol in 1997, the Copenhagen Accord in 2009 and the Cancun agreements in 2010.

Unlike the Kyoto Protocol, the Copenhagen and Cancun gatherings did not succeed in producing legally binding commitments from any countries. Nonetheless, agreements were made in each to reduce greenhouse emissions and to limit average temperature rises by less than 2 degrees above pre Industrial Revolution temperatures. This mitigation is expected to be achieved by measures such as the development of alternative energy sources, reduction of land clearing and the use of cleaner fuel burning technologies.

References
Harmon, K., 2009, ‘A Less Shady Future: Could Climate Change Mean Fewer Clouds? , scientificamerican.com
IPCC, 1990, 'Climate Change - The IPCC Scientific Assessment', ipcc.ch
NASA, 2000, ‘Clouds and Climate Change: The Thick and Thin of it’, Goddard Institute for Space Studies, nasa.gov
Walsh, B., 2009, ‘In a Warming world, Cloudy Days Are a Boon’, time.com

Thursday, 4 April 2013

Greenhouse Gases and Global Warming


The relative contributions of the various greenhouse gases to global warming may not be as clear as some sources would have us believe.
Thawing Ice on Hudson Bay
Thawing Ice on Hudson Bay - Jeff Schmaltz
Greenhouse gases are defined as those gases that act to trap outgoing long wave, or infra red, radiation as it leaves the Earth. The time taken for this radiation to escape the atmosphere is consequently prolongued and results in a net heating effect directly above the Earth’s surface. A reasonably persuasive correlation exists between increases in global temperatures and anthropogenic (human induced) greenhouse gas emissions since the Industrial Revolution.
What Are the Major Greenhouse Gases?
According to the Fourth Assessment Report of the Intergovernmental Panel on Climate Change (IPCC) in 2007,the main greenhouse gases, in order of decreasing contribution to global warming, are carbon dioxide, methane, chlorofluorocarbons (CFCs), nitrous oxides and ozone (see figure 2). These figures do not actually reflect the relative heat absorbing qualities of each gas – if they were compared molecule for molecule , CFC’s, nitrous oxides and methane would all have higher heat trapping properties (or ‘Global Warming Potentials’) than carbon dioxide (see figure 2).
However, the calculations used to arrive at the overall warming contribution of each gas also incorporate their atmospheric concentrations. Hence carbon dioxide is the largest contributor to global warming due to its much higher concentrations in the atmosphere: 370 parts per million compared to 1.75 parts per million for methane , 0.75 parts per billion for CFCs and 310 parts per billion for nitrous oxide.
The actual contributions to global warming are therefore around 50% for carbon dioxide, 18% for methane, 14% for CFCs and 6% for nitrous oxides (see figure 2). Ozone’s contribution at 12% is sometimes a point of debate, due to the differing effects it has in the troposphere compared to the stratosphere.
Sources of Greenhouse Gases
Fig. 2: The Relative Importance of Greenhouse Gases -gcrio.org
The major sources of anthropogenic carbon dioxide are the combustion of fossil fuels and biomass and land clearing. Most scientists agree that atmospheric concentrations of this gas have increased from around 280 ppm to 370 ppm since the Industrial Revolution in the early 1800s.
Atmospheric concentrations of methane have increased by around one per cent per year since the 1960s, largely because of increased farming practices. Most methane is released in rice paddies and by grazing cattle, but it can also emanate from coal mining activities and by burning off of vegetation.
Nitrous oxides are produced by the combustion of fossil fuels and the use of nitrogenous fertilizers, while CFCs are present in refrigerants and propellants used in aerosol cans. Ozone is created in the troposphere (lower atmosphere) as a by product of photochemical smog ( nitrogen dioxide can form ozone in the presence of sunlight), and is made by natural processes in the stratosphere (upper atmosphere).
The Role of Water Vapour in Global Warming
Some climate ‘contrarians’ would argue that anthropogenic emissions of greenhouse gases are negligible when compared to the fact that water vapour contributes to greenhouse warming more than any other gas. Indeed, they often indicate that the IPCC and other scientific sources do not even include it in lists of common greenhouse gases.
Former climate Scientist, William Connelly, however, points out that although water vapour contributes up to around 70% of global warming, human activities do not markedly affect its atmospheric concentrations and it therefore has only a feedback, rather than a forcing, effect. This feedback effect is influenced by increases in anthropogenic greenhouse gases such as carbon dioxide and methane because the elevated atmospheric temperatures caused by these gases allow more water to evaporate, which in turn creates further warming.
Water vapour, then, is more a ‘submissive’ greenhouse gas than a dominant one, according to Connelly. NASA scientists have also recently reached similar conclusions using customised atmospheric infrared equipment.
Ozone and CFCs – Controversial Greenhouse Gases?
Because of the link between ozone and CFCs (stratospheric ozone is depleted because of the effect of CFCs), some climatologists argue that their warming effects could be cancelled out. This is because a reduction in the amount of ozone in the upper atmosphere will decrease the retention of outgoing infra red radiation. According to the IPCC Fourth Assessment Report, recent reductions in stratospheric ozone have indeed produced a slight cooling effect.
Moreover, the fact that ozone is distributed unevenly throughout the atmosphere has added to the confusion- while the IPCC have concluded that the warming effects of tropospheric ozone are about 25% of that contributed by carbon dioxide, the combined effects of tropospheric and stratospheric ozone tend to cloud this data.
Despite the question marks surrounding the net effects of water vapour, CFCs and ozone, scientists are in agreement about their heat trapping potential at the molecular level. Many are also unequivocal in their view that anthropogenic carbon dioxide has an overriding effect on climate patterns. Future atmospheric concentrations of each of the major greenhouse gases will no doubt dictate their overall effects on global warming.
References
Connelly, William, 2005, 'Water Vapor; Feedback or Forcing?', realclimate.org
HIeb, Monte, 2003, 'Water Vapour Rules the Greenhouse System', geocraft.com
IPCC, 2001,'Third Assessment Report: climate Change 2001', ipcc.ch
IPCC, 2007, 'Fourth Assessment Report; Climate Change 2007', ipcc.ch
Lashof, D. and Ahuja, D., 1990, 'Relative Contributions of Greenhouse Gases to Global Warming', nature.com
NASA, 2008, 'Water Vapour Confirmed as Major Player in Climate Change', nasa.gov
World Nuclear Association, 2007, 'Global warming- The Science', world-nuclear.org


Wednesday, 3 April 2013

Carbon Sinks and Greenhouse Warming


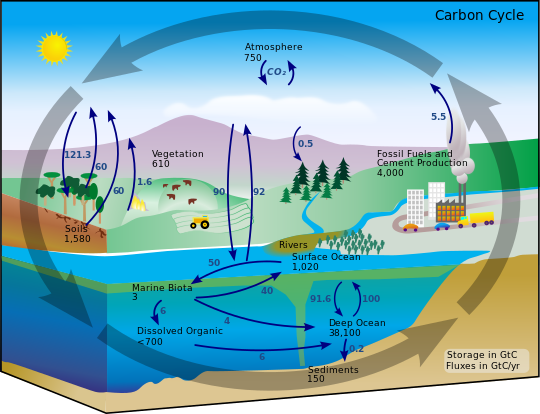
File:Carbon cycle-cute diagram.svg
The Carbon Cycle - Kevin Saff

Carbon sequestration techniques may soon be needed to supplement natural carbon sinks as a means of 'mopping up' excess atmospheric carbon dioxide.

A natural carbon sink is defined as anything that absorbs more carbon than it produces, whereas a natural carbon source produces more carbon than it absorbs. Natural carbon sources include the respiration and decay of living organisms, emissions from volcanoes and bushfires and gaseous exchange between the oceans and the atmosphere. Natural carbon sinks include the soil, oceans, forests and solid earth.
Although the time taken for carbon to cycle between the atmosphere, the surface waters of the ocean and living things is relatively brief, a large amount of carbon is locked away in the form of coal, oil and natural gas or as inorganic carbonates on the ocean floor. It takes millions of years and the presence of volcanic activity for carbon to be released from carbonates, while the carbon in fossil fuels remains trapped indefinitely.
Why Can’t the Oceans Absorb All the Excess Carbon Dioxide?
Industrial activities involving the burning of these fossil fuels have consequently upset the natural carbon cycle. These, and other human activities such as cement production and land use change, have added around 5.5 Gt (gigatonnes: 1 Gt = 1 billion tonnes) per year to the atmosphere (see above diagram). According to studies made by Samar Khatiwala, the oceans only absorb about 20-35% of all man made carbon dioxide emissions and may have in fact decreased their rate of absorption by around 10% since 2000.
Moreover, as atmospheric temperatures increase, the solubility of carbon dioxide in the oceans will decrease, thus reducing their effectiveness as carbon sinks. This is supported by studies showing that even in present conditions around 40% of all anthropogenic (human induced) carbon dioxide is absorbed in the cold waters of the Southern Ocean near Antarctica.
Indeed, even if more carbon dioxide does dissolve in the oceans, the resulting increase in acidity may adversely affect marine life. As a consequence, relying on the oceans to soak up excess carbon emissions is not a realistic option.
How Reliable are Forests as Carbon Sinks?
While plants take up carbon dioxide as a means of manufacturing organic compounds in photosynthesis, it should be noted that a forest or an expanse of grassland will only have a net ‘sink’ effect while it is growing. When large areas of vegetation reach maturity, the carbon released through respiration and decay will eventually balance any carbon taken up in photosynthesis. The uptake of carbon dioxide by forests can therefore range from 1.0 to zero Gt per year.
In addition, when sudden bushfires or deliberate burning off of this vegetation occur, large amounts of the carbon that has been stored in the plant material is released all at once into the atmosphere. Attempts to reforest or ‘afforest’ (create new tracts of forest) large areas of land as an attempt to gain carbon credits may therefore only offer a temporary carbon storage solution.
Organisations such as ‘Fern’ use this argument to question the wisdom of the Kyoto Protocol decision in 2001 to allow nations to offset their industrial carbon emissions with tree planting. Indeed, they also point out that increasing the area of forested land will interfere with the livelihoods of farming communities and could also reduce the earth’s ability to reflect heat (known as its ‘albedo’).
Until recently, scientists believed that enhanced atmospheric carbon dioxide levels would promote the growth of vegetation (as a result of increased photosynthesis), which would subsequently result in greater carbon sequestration. Various studies, including those made by Dr Richard Norby, however, have shown that limiting factors such as nitrogen levels in the soil will restrict the extent of plant growth under greenhouse conditions.
Soils as Potential Carbon Sinks
Carbon, in the form of humus, is taken up by soils, and is a key ingredient in soil organic matter. Estimations of the amount of carbon held in soils range from 700-1000 Gt .When soils are tilled, however, organic matter previously protected from microbial action is decomposed rapidly because of changes in water, air, and temperature conditions.
This carbon loss can be reduced by using alternate farming methods which include ‘no till’ farming, crop rotation, the use of manures and mulches and winter cover crops. Such methods cannot, however, be relied upon to help the soil act as a sink for excess greenhouse carbon.
Man Made Methods of Carbon Sequestration
In light of the above, scientists are consequently using available technology to devise their own methods of carbon sequestration. In terms of increasing the capacity of the soil to absorb carbon, one solution may lie in the development of ‘biochar’, a product formed from the pyrolysis of biomass. In this process, green waste is heated in the absence of oxygen to produce a carbon rich substance – ‘biochar’- that can be added to soils as a fertilizer.
Other sequestration methods being explored include geosequestration (storing carbon deep in the ground), mineral carbonation (converting atmospheric carbon dioxide into carbonates) and ocean sequestration. All techniques are currently in the experimental stage, and will not offer a solution to global warming in the short term. As a consequence, immediate reductions in greenhouse gas emissions would appear to be a more logical line of action to take.
References
Bevan, P., 2007 ‘Soils Offer New Hope as Carbon Sinks’, dpi.nsw.gov.au
Fern, 2010, ‘What Are Carbon Sinks?’, fern.org
Khatiwala, S., 2009, ‘Reconstruction of the History of Anthropogenic CO2 Concentrations in the Ocean’, nature.com
Parliament of Australia Library, 2010, ‘Carbon Sequestration’, aph.gov.au
University of NSW, 2010, ‘Trees Unreliable Carbon Sinks’, sciencealert.com


Monday, 1 April 2013

Aerosols and Global Warming


Figure 1: Effects of Aerosols Over the Indian Ocean
Fig. 1 - The Effects of Aerosols Over the Indian Ocean
The influence of atmospheric aerosols on global warming may not be as clear as scientists have previously believed.
Aerosols are classified as 'small particles suspended in the atmosphere'. Around 90% of atmospheric aerosols have natural origins, and include sea salt, dust, organic carbon from forest fires and sulfurous gases from volcanic activity. In addition, dimethysulfides from ocean algae can produce sulfate aerosols.
The remaining 10% of atmospheric aerosols are anthropogenic (human induced). Most of these consist of sulfates and carbon particles from the burning of biomass or fossil fuels. Sulfates are produced when sulfur dioxide from fossil fuels reacts with water vapour and other gases, while organic carbon and black carbon are produced when biomass is burned in land clearing activities. Although aerosols have a short lifetime in the atmosphere, they are quickly replaced by anthropogenic activities and wind erosion in dry areas.
The Significance of Aerosol Particle Size
When the size of aerosol particles is 2 micrometres or less (examples include sulfate particles and organic carbon), they tend to scatter, reflect and absorb incoming solar radiation. This tends to have a cooling effect, whereas particles larger than 2 micrometres (such as black carbon or soot) tend to absorb outgoing long wave radiation, creating a warming effect.
Aerosols Have a Net Negative Forcing Effect
Radiative forcing is described as the influence a substance has on atmospheric temperatures, and is usually quantified in watts per square metre (W/m²). As a whole, aerosols act to cool the atmosphere, and so have a negative forcing effect. Indeed, it is estimated that the sulfate aerosols from a single volcanic eruption can reduce global temperatures by around 0.3°C for up to 2 years.
The aerosols with negative forcing effects include sulphates ( -0.4 W/m²) and organic carbon from fossil fuels and biomass burning (- 0.15 -0.25 W/m²). Black carbon, however, has a positive forcing effect of +0.2 W/m².
Indirect Effects of Aerosols on Climate
In addition to their direct role in reducing global warming, aerosols (particularly sulfates), can affect cloud lifetime and droplet concentration by acting as cloud condensation nuclei. This tends to have a further cooling effect because of increased scattering of solar radiation.
As a consequence, some scientists believe global warming may well increase if measures to reduce future sulfate aerosol production are effective. Author Matthew Mc Dermott , however, points out that it is more likely that black carbon from Asian pollution will increase in the future. In either scenario, atmospheric temperatures are predicted to rise.
Another indirect effect of aerosols may be their influence on rainfall patterns: while they can increase droplet formation in clouds, recent studies have suggested that the nature of these droplets is such that actual rainfall in these clouds is delayed. As a result, when the cloud eventually forms rain later in its life cycle, the precipitation is more intense, causing flooding in some areas while other locations are subjected to drought conditions.
Pollution in China May be Affecting Rainfall in Australasia
Moreover, the variations in atmospheric temperatures caused by aerosols may be causing weather patterns to shift to other areas.The effects of this phenomenon over Australasia have been studied by CSIRO scientist Dr. Leo Rotsteyn, who suggests that increased anthropogenic haze over Asia (see figure 1) has increased rainfall in Australia between 1951 and 1996. This, he maintains, is caused by changes in temperature and pressure gradients over the Indian Ocean which have resulted in monsoonal winds moving further towards northwestern Australia.
The Intergovernmental Panel on Climate Change (IPCC) has recognised these examples of the more subtle effects of aerosols and acknowledged in 2008 that aerosols are the ‘dominant uncertaintly in radiative forcing’. NASA have responded to this statement by announcing the launch of their ‘Glory’ satellite in February. This craft will use state of the art equipment to monitor the impacts of aerosols on global temperatures in an attempt to clarify some of the controversy surrounding these tiny atmospheric particles.
References
CSIRO, 2006, ‘Aerosols and the Climate’, csiro.au
IPCC Third Assessment Report, 2001, 'Climate Change 2001, the Scientific Basis' , grida.no
Mc Dermott, M., 2009, ‘Aerosols More Important to Global Warming Than Acknowledged’, treehugger.com
Science Daily, 2008, ‘Role of Aerosols in Climate Change Examined’, sciencedaily.com


New Caledonia and its Links to Gondwana


The Cagou - Quartl
Various plant and animal species on the main island of New Caledonia provide evidence that it was once a part of the supercontinent Gondwana.
Grand Terre, the main island of New Caledonia, is situated on the Australian tectonic plate, a crustal plate that is moving northwest at a speed of approximately 7.3 cm per year. It separated from Australia and Antarctica during the Cretaceous period, around 65 million years ago. Although subsequent subductive earth movements account for much of its igneous rock formations, Grande Terre’s older rock formations are from the Gondwana era.
The Absence of Mammals Showing a Link to Gondwana
Interestingly, although a wide range of New Caledonia’s flora displays links with Gondwana species, its fauna does not. The mammalian life present is limited to several species of bats that have colonised the island via the air. Some groups of vertebrates, including reptiles and birds, do, however, show a relationship (to the genera level) to those in New Zealand, while various invertebrates such as spiders and snails show affinities with Australian and New Guinean species.
This disparity may be explained by the apparent submersion of most of Grande Terre during the Eocene era. This, combined with the fact that the environmental conditions on an island are not suitable for the survival of animals that need large territories to search for food, may explain why mammals from Gondwana did not survive.

The Cagou – A Vertebrate With Connections to Gondwana
The Cagou (see above) is an example of a New Caledonian vertebrate species that does show links to Gondwana. This endangered bird is a member of the Rhynochetides family of flightless birds thought to have had their origin in New Zealand. The distribution of similar flightless birds (collectively known as ratites) on former Gondwana continents, is generally regarded as evidence for both the Plate Tectonics theory and Darwin’s theory of evolution by natural selection.
These birds, which also include the emu in Australia, the kiwi in New Zealand and the Ostrich in Africa, are thought to have evolved from a flightless ancestor that lived on the supercontinent before it broke apart. As with the plant species on former Gondwana continents, the ratites are believed to have then evolved in isolation, with their own unique environmental conditions acting as selecting agents.
Plant Species with Gondwana Origins in New Caledonia
Around 2400 of the 3000 plant species in New Caledonia are endemic. This is explained by the fact that after it separated from Gondwana new species evolved in isolation in a process biologists call ‘adaptive radiation’. Despite this, around 26% of New Caledonia’s flora shows affinities with Australian species.
Perhaps the most notable examples of this are members of the genus Araucaria, which can be found in Australia, New Caledonia, New Guinea and other former Gondwana continents. The Hoop Pine (Araucaria cunninghamii) is present in both Australia and New Caledonia (see figure 2), while similar Araucaria genera are endemic to New Caledonia. In fact thirteen out of the nineteen known species of Araucaria are found in New Caledonia, with the large stands of Araucaria columnaris on the Isle of Pines being among the most spectacular.
Other plant families in New Caledonia showing connections to former Gondwana continents include the Proteaceae (including Grevilleas, Persoonia and Stenocarpus species), the Myrtaceae and the Cunoniaceae. The Rhizophoraceae, a family of mangrove species, is also common to these continents, with the species Rhizophora apiculata (see figure 3) occurring in New Caledonia, Australia, India and New Guinea.
The Uniqueness of New Caledonian Flora and Fauna
Despite some of these relationships to former Gondwana species, the flora and fauna of New Caledonia is still among the most unique in the world. Besides having a large percentage of endemic species, New Caledonia also boasts the world’s largest bio-diversity of organisms per square kilometre.
This is partly a result of the wide range of micro-habitats present in the mountainous regions of the country, along with the rich soils formed from oceanic crust during the Eocene era. In addition, New Caledonia’s long period of geographic isolation has greatly contributed to the distinctiveness of its animal and plant life.
References
Croixdusud.info, ‘Biodiversity in New Caledonia: Land Animals and Flora’, croixdusud.info
Netbiome, 2011, ‘New Caledonia’, netbiome.org
Sum.org, 2006, ‘New Caledonia’, sum.org
Weston,P., 2006, ‘The origin of Species: The Australian Connection’, Australian Academy of Science,science.org.au